Customer churn is one of the most common challenges faced by businesses today. Retaining existing customers is often more cost-effective than acquiring new ones, which makes churn prediction a high-impact area for data science. In this post, I’ll walk you through how I approached this problem using logistic regression and explained the results with SHAP values.
Why Churn Prediction Matters
Churn occurs when customers stop doing business with a company. For telecoms, this might mean switching providers; for SaaS, it’s canceling subscriptions. By predicting churn in advance, companies can take proactive steps—like offering discounts, improving service quality, or personalizing communication—to retain valuable customers.
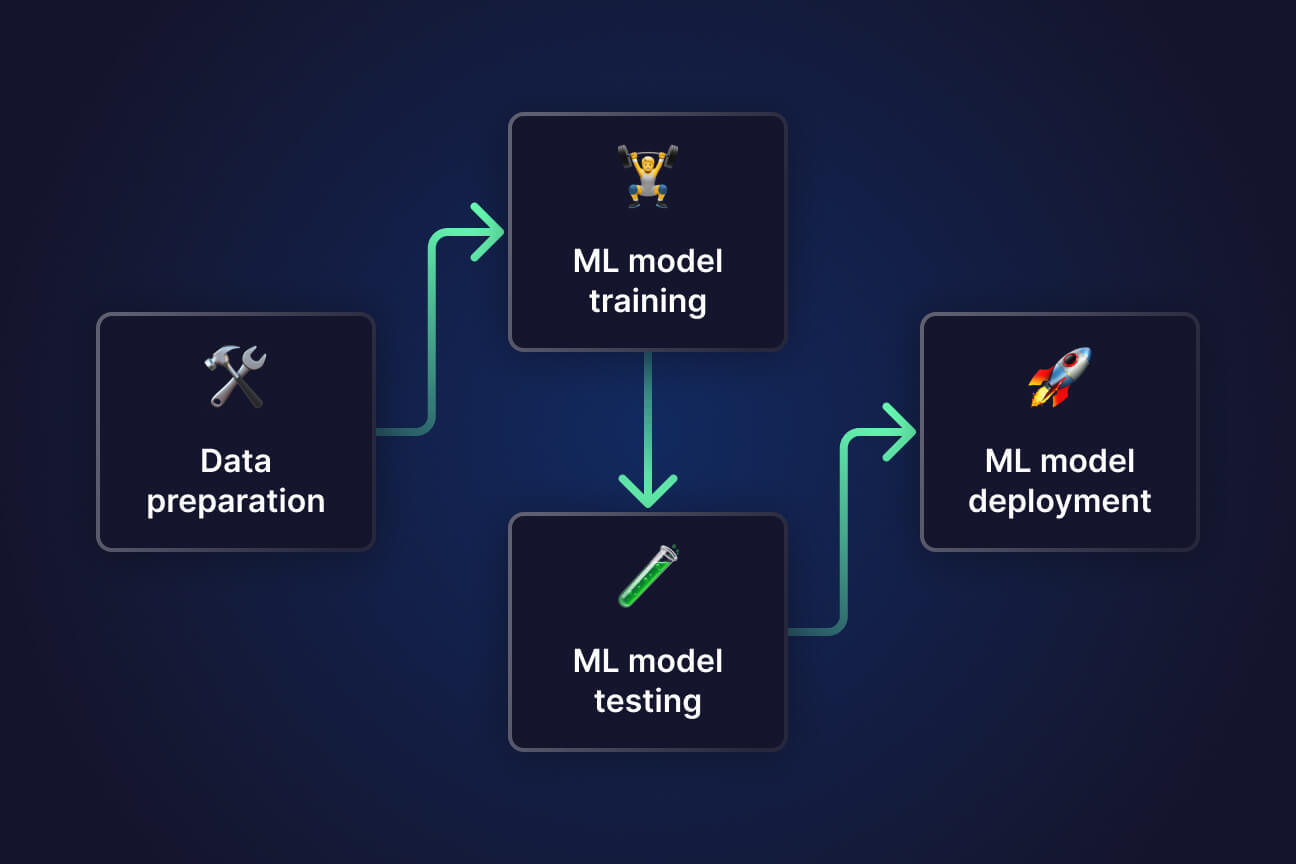
Data & Preprocessing
For this project, I used a publicly available telecom churn dataset. The preprocessing steps included:
Handling missing values.
Encoding categorical variables such as contract type and payment method.
Standardizing numerical features (tenure, monthly charges, total charges).
Splitting the dataset into training and testing sets (80/20).
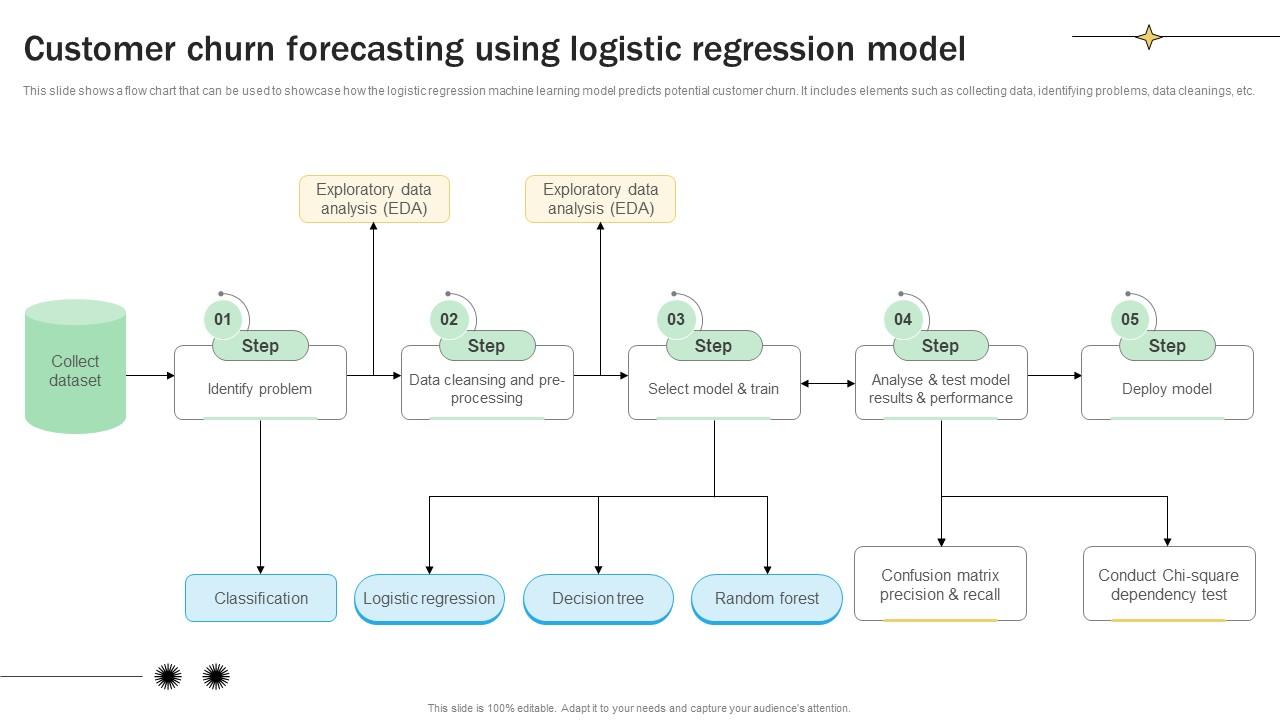
Building the Logistic Regression Model
Logistic regression is simple yet effective for binary classification problems like churn (Yes/No).
Steps I followed:
Fit the logistic regression model using the training dataset.
Evaluated performance with metrics: accuracy, precision, recall, F1 score, and AUC-ROC.
Tuned hyperparameters like regularization (L1 vs L2) to balance bias and variance.
The final model achieved ~82% accuracy with strong recall, which is crucial for catching as many churn cases as possible.
Explaining Results with SHAP Values
One challenge with logistic regression (and most ML models) is explaining why the model predicts churn. That’s where SHAP (SHapley Additive exPlanations) comes in.
Using SHAP, I identified the most influential features:
Tenure – Shorter-tenure customers were more likely to churn.
Contract type – Month-to-month contracts had higher churn risk than long-term ones.
Monthly charges – Higher charges correlated with churn.
This interpretability is key for business stakeholders who want not just predictions but actionable insights.
Key Insights
Customers with short tenure and month-to-month contracts are the riskiest group.
Offering loyalty benefits or discounts to high-risk customers can significantly reduce churn.
SHAP values provide a transparent explanation that improves trust in the model.
Final Thoughts
This project reinforced my belief that even simple models, when well-explained, can make a huge impact. Logistic regression, combined with interpretability techniques like SHAP, bridges the gap between technical modeling and business decision-making.
If you’re starting out in data science, churn prediction is a fantastic project to practice both classification modeling and model explainability.
“Seader will be distracted by the readable content of a page when looking at its layout. The point of using Lorem Ipsum is that it has a more-or-less normal distribution of letters.”


1 Comment
Kia Hoffman
April 22, 2025“Seader will be distracted by the readable content of a page when looking at its layout. The point of using Lorem Ipsum is that it has a more-or-less normal distribution of letters.”