Hi, I am Mohammad Umair
Data Scientist & Machine Learning Engineer
Building predictive models, AI solutions, and data-driven insights to solve real-world problems.
About Me
I’m a data science engineer specializing in analytics, visualization, and performance evaluation. I work at the intersection of data and strategy to extract insights that create real-world value.
What I do
- Data Analysis & Visualization
- Performance & Behavioral Analytics
- Data Cleaning & Processing
- Insight Reporting & Dashboards
My Approach
I believe good data analysis goes beyond tools—it requires curiosity, context, and clarity. I aim to present insights that are actionable, transparent, and aligned with real-world goals
Projects
Hands-on projects applying data analysis to real-world problems.
Focused on turning raw data into meaningful insights.
01
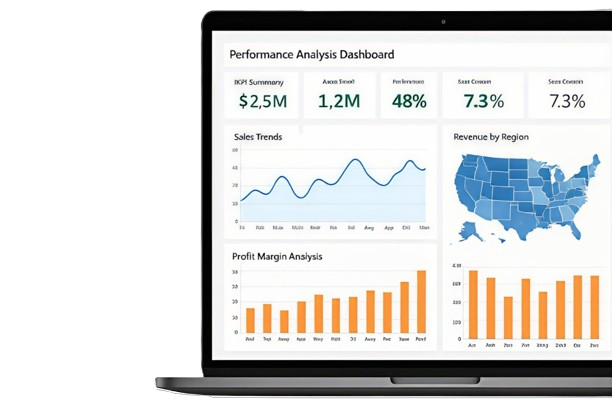
Performance Analysis Dashboard
This project focuses on analyzing performance metrics to identify trends, strengths, and areas for improvement. Raw data was cleaned, structured, and transformed into an interactive dashboard that highlights key indicators and comparative insights.
- Data cleaning and preprocessing
- KPI identification and performance tracking
- Interactive visualizations for decision support
Tools Used
Python, Pandas, Matplotlib, Power BI / Tableau
02
Behavioral & Emotion Data Analysis
A data-driven study aimed at understanding behavioral patterns and emotional indicators through structured datasets. The project emphasizes extracting meaningful signals from complex data and presenting insights in a clear, understandable format.
- Pattern recognition and trend analysis
- Feature extraction from behavioral data
- Insight-focused storytelling with data
Tools Used
Python, NumPy, Seaborn, Jupyter Notebook
03
Motion Tracking & Performance Insights
This project analyzes motion-based data to evaluate performance efficiency and consistency. By processing time-series data, the project delivers insights that help optimize performance and reduce variability.
- Time-series data analysis
- Performance comparison and benchmarking
- Visualization of motion trends
Tools Used
Python, Pandas, SciPy, Data Visualization Libraries
04
Data Pipeline & Automation Workflow
Designed and implemented a data pipeline to automate data collection, cleaning, and reporting. This workflow reduced manual effort and improved data reliability across multiple reporting cycles.
- Automated ETL process
- Data validation and error handling
- Scalable and reusable workflow design
Tools Used
Python, SQL, APIs, Automation Scripts
“Information is the oil of the 21st century, and analytics is the combustion engine.”
Peter Sondergaard
Former SVP, Gartner
